
In the past, they said that the big companies ate the little ones – today the fast ones overtake the slow ones. CrossFields helps companies become the fastest in their industry.
We do this by creating a detailed availability model which in an exeprimental environment allows you to “fail fast, learn fast and fix fast” and thus get on the market with a more mature product with optimized maintenance strategies.
This article is about design of new products, but the method is just as useful when it comes to project development, where the purpose is to find the best products for your project, or for asset management in terms of obtaining the highest availability and lowest OPEX.
Various applications
Our model has many applications. When I work with the design of new products I use it to make optimized design choices, forecast KPIs as well as optimizing service and maintenance strategies.
Optimization
During the design phase I start by dividing the entire system into subsystems. Then I identify all the critical components of each subsystem which will typically be the ones I am interested in.
Then I build a model of each subsystem – I determine the lifetime distribution and the corrective action that should be used when the component fails.
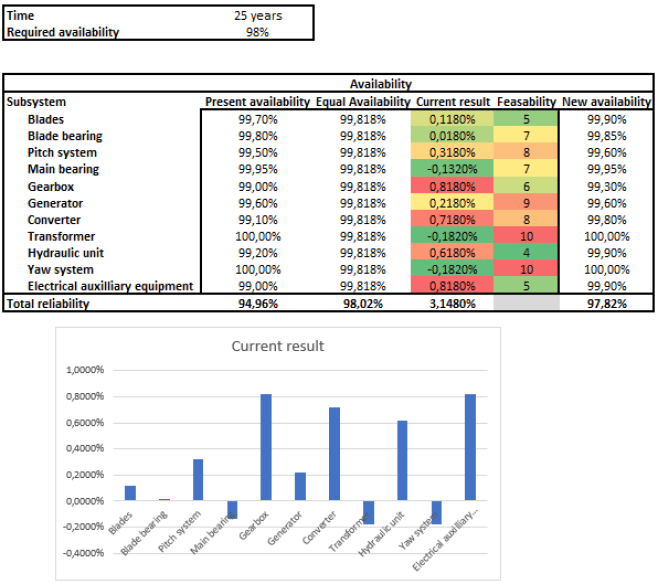
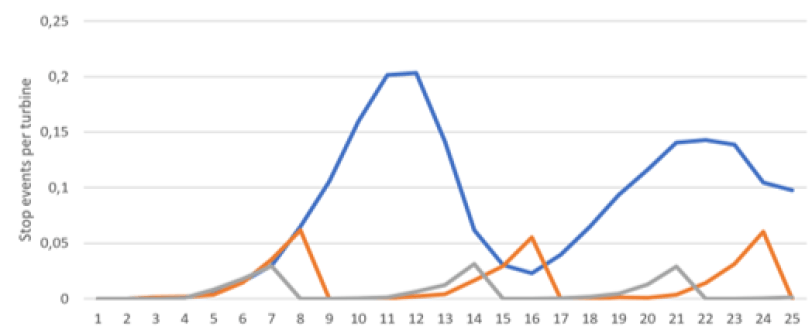
Then, to get an idea of where it makes sense to work to improve the current KPI, I identify the feasibility for each subsystem and how far it is from the average – see figure 1.
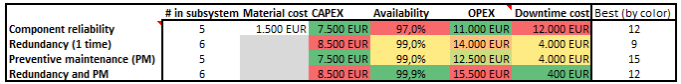
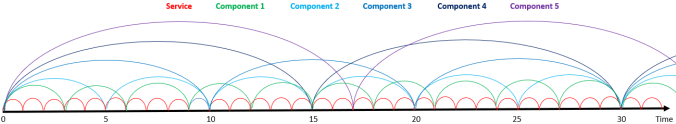
After deciding which subsystems I want to optimize I move down to component level where I systematically simulate different options. The model allows me to quickly get feedback on the impact of individual opportunities on the KPIs –
see figure 2.
When this process is over I hold a design that is much more mature than if I had used a traditional approach, with which I would be dependent on feedback from the field – in some cases taking many years to achieve.
Forecasting
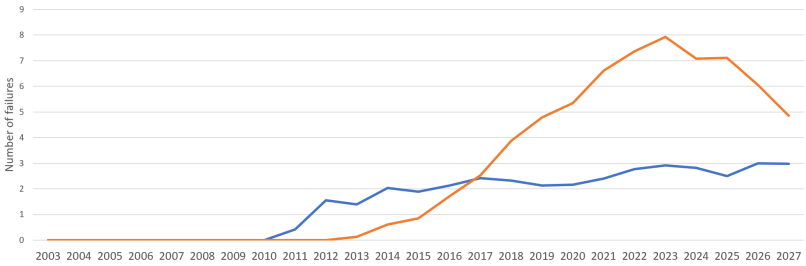
Once the design is locked – in the cases where the maintenance strategy was part of the process – one can also forecast the development of the CPIs as well as errors in the components for the desired period. The forecast acts a bit like a
compass: of course, you have to correct along the way but you would be ill off without it.
Optimize maintenance strategy
Normally I will place the service and maintenance strategy in connection with the design phase. I want to optimize the strategy by choosing the optimal maintenance strategy for each component.
Bundling
Bundling is a strategy for preventive maintenance. In connection with preventive maintenance planning you identify the best moment to proactively replace a component and in many cases it is best to perform the replacement in connection
with already scheduled service visits. Sometimes several different components must be replaced the same year and this is how bundling comes into the picture by taking the entire group of components and replacing at the same time – during service.
KPIs
The KPIs I use are universal and allow you to compare different designs of all asset classes.
Components lifetime distributions
It is the lifetime distribution that controls the entire model so it is critical that you have a stable and systematic method to obtain this if you do not have actual data to inform of the distribution.
When developing new products there is no data from the product under developement, unless it is minor changes on an existing design. If you have previously made a similar design, there may be some components data that you can use.
If that is not the case you have to model the lifetime distribution – I use a process I call fact analysis.
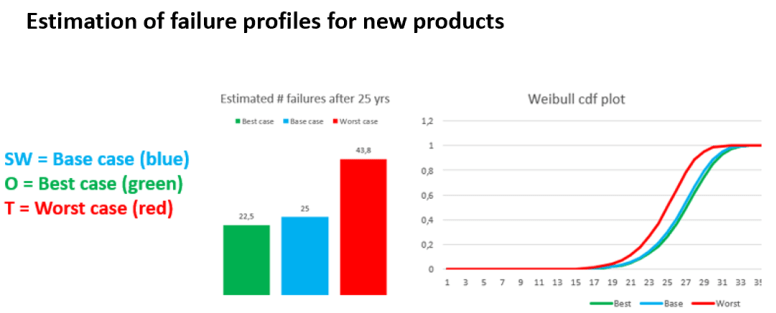
Modelling lifetime distributions is usually associated with greater risk of failure than traditional data analysis. To handle this risk I use statistics to define upper and lower limits.
I would never recommend replacing components proactively without verifying that the wreckage is actually running. There are different methods of handling this.