Introduction
RCA is a discipline where you can really waste a lot of time on not achieving useful results. I have written an article that tells a little about my method, that quickly shuts down on some of the issues where you can waste time.
There may be a big difference when choosing to use resources on an RCA. There is often a lot of consensus about using it on large and expensive components, but in the case of smaller components, no RCA is performed – they do not cost much …
It may be a bad decision because there may be many of the smaller components, maybe they also experience more lifecycles throughout the lifetime of the wind turbine and for some assets the downtime is the cost driver.
The decision may also be affected by whether or not the assets are out of warranty. You seem to be within the warranty period, so it’s not important because the supplier just replaces the component, but when the warranty expires, it’s important to be aware of all the inconveniences.
When should you start an RCA?
You should always quantify the risk, and here you must include lost production, so you lose the opportunity to earn money.
What mistakes are often seen during a RCA
The examples below all lead to an ineffective and more expensive process, giving unsatisfied customers (external and internal), a more expensive process that might lead to a short-term solution, a lot of firefighting and a stressed organization.
Trial and error
I often see that you go straight to a convenient solution and find evidence that supports it. One may be lucky to have a right, but usually it will lead to a new RCA at a later date.
No structured method
If you start an RCA without having a structured approach, then you investigate random things to the right and left, and investigate things that you might have ruled out at the previous level in the cause and effect chain.
Insufficient knowledge
Lack of knowledge can relate to the specific problem, but it may also be unknown to valuable tools.
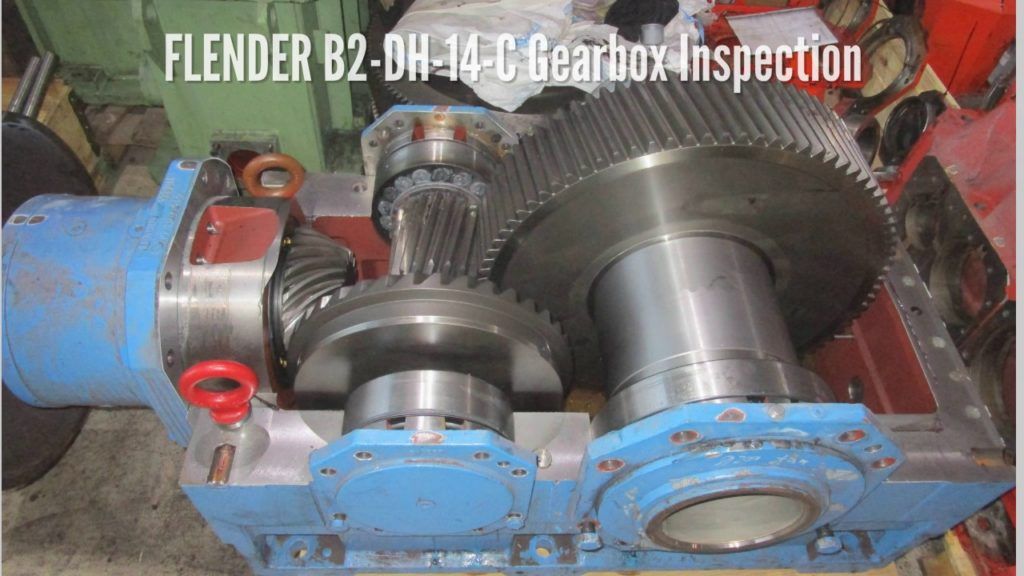
An example may be that you participate in a disassembly of a component. A disassembly can be quite expensive and when it’s finished, there’s no second chance because parts are removed and sometimes destroyed. So, it’s important to get all relevant things checked when you’re in progress. It’s not a plan that is done on the spot, too much happens around one, and you’ll definitely overlook important clues. You have to be proactive and not reactive!
Some of the tools I have good experience with
RCA is a cross-disciplinary task, so it’s about identifying a small team with the right skills, I do not want to go into more detail about the skills in this post because it depends on the specific problem. Instead, I want to tell what I often contribute.
Through many years of work with RCA, on and off, I have gained a broad knowledge of methods and tools.
The method
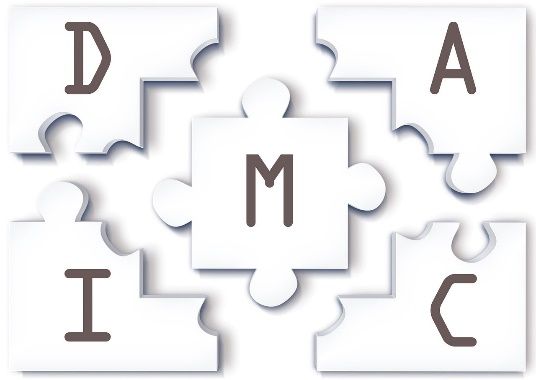
One method can be as well as the other, as long as you use the right tools. I have found that DMAIC (Define, Measure, Analyze, Improve and Control) fits me well. I will briefly describe what happens in the different phases.
Define
The D phase describes the problem, its extent and the risk. The right competencies are identified, making a budget for both time and money and stakeholders are identified.
Measure
In the M phase, information is collected and is described by statistics.
Analyze
In the analysis phase, things are examined cross-sectionally. Here you also control what potential opportunities are in play, and hopefully with the right root cause – sometimes there are several reasons for a problem.
Improve
In the improvement phase you reach, through systematic, to the best solutions and implement them. It always involves removing a link in the cause-and-effect chain of the identified root cause, or changing it completely. In this phase, you will also decide on the KPIs to be used to follow up at a later date, to ensure you have found a lasting solution.
Control
The control phase takes some time after the solution was implemented in the Improve phase. It is monitored whether solutions work as expected, based on the KPIs that were raised. Is everything as expected if something is wrong, you have to go back to the analysis and / or the Improve phase.
The tools
The tools in Six Sigma emphasize that the process should be data driven and fact based. I will shortly describe some of the tools I use.
Data analyses
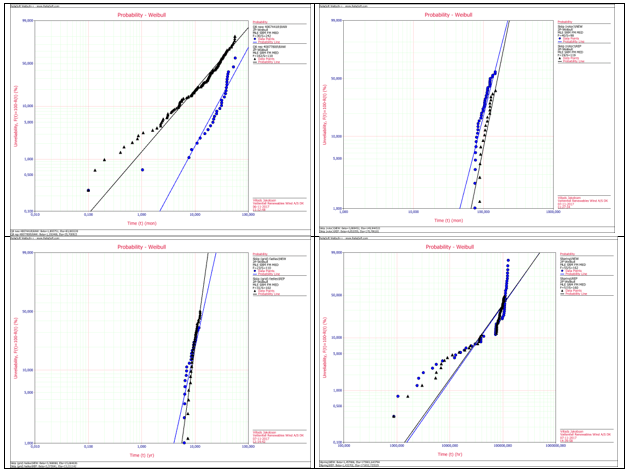
I use many different kinds of data analysis, but there is one analysis I think is particularly important, because it tells me in which life phase the component failed.
This is important because causes belong to life phases, which is not the case for failure modes as they can happen from the first day in operation as well as the last day.
The analysis I will emphasize is life data analysis, an analysis of component failures, as mentioned it gives the life phase and also tells me something about the reliability of the component. When I know the life phase there is a lot of potential causes I can rule out, and focus on the remaining potential causes.
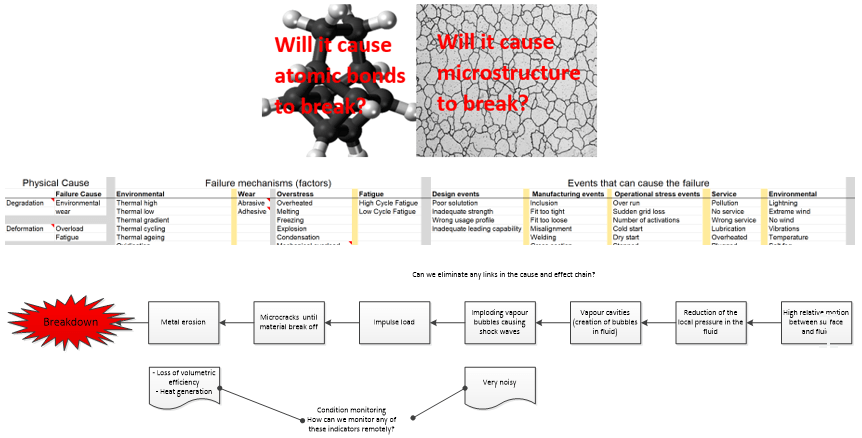
Physics of Failure (PoF)
Behind all FM is a chain of coherent cause-and-analysis links. If you can sketch this chain as long as possible, you will usually find the cause of the problem. To solve the problem, you should find out which one is most appropriate to break the chain. You may want to break more joints or come up with a brand-new solution that has another chain of cause-and-effect links.
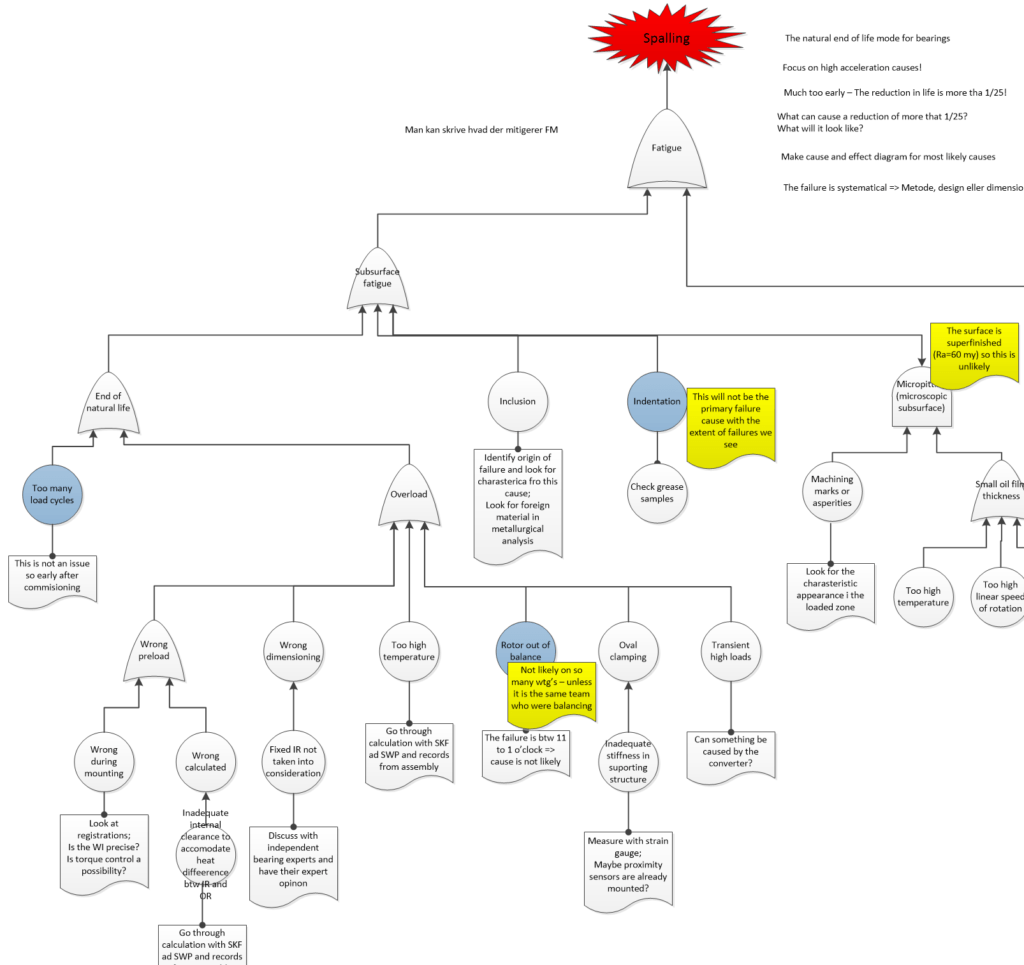
Failure tree
It can be a complex affair to keep track of all the mistakes there, but also to ensure that you do not waste time and resources to control the same “path” on several levels. The error tree is my favorite tool to control the analysis phase.
Parts Block Diagram (PBD)
Parts block diagram is a block diagram where I divide a component and its interfaces into the individual parts that it consists of, oil and gases are also considered components in that division.
The breakdown is done to focus on what can cause variation. The idea is that there should be an undesired variation in order to cause a failure.

Input-Part-Critical Output (IPO)
In the 6-sigma world there is a tool called IPO (Input, Process, Output), it is a good tool for solving more process related problems. I have changed the tool and use it to make sure I get all that is relevant to a component separation (Input for sources for variation), Part, Critical Output).
Below the I, I list all the sources of variation that are on each part, the P is the name of the part and below the C lists all the critical outputs that the variation can lead to.
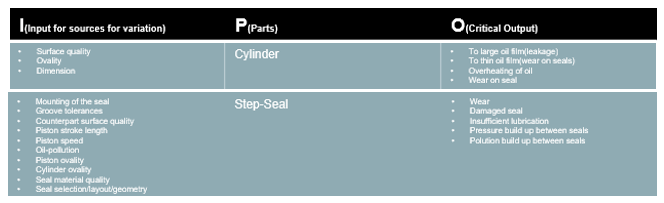
Once I have used PBD and IPO, I’m ready for a component separation, I know exactly what can lead to variation and what to look for. I have also made an inspection schedule based on the two tools, so I can work quickly and efficiently.
Concluding remarks
I have many tools in my RCA toolbox, which is something for most situations. What’s important is to find the true root cause for the first time, but also to do it quickly and efficiently without compromising. Have a method, good tools, the right skills, avoid biases and trial and error!