Excellent availability does not come by itself, it’s something to plan. It’s often a low hanging fruit and often you will get a good return on the amount of time you spend on picking it.
Introduction
There are different kinds of availability – in this article I will only consider Operational Availability. This is a measure of the “real” availability over a period of time and includes all experienced sources of downtime.
I have divided sources of downtime into three categories – annual service, turbine stop with remote reset and unplanned maintenance (incl. BoP). The length of the downtime:
• Annual service 2 – 4 days
• Turbine stop with remote reset Relatively short time
• Unplanned maintenance Relatively long time
What is the downside importance for availability?
In order to work with improvements for availability it is important to have an idea of how the downtime is distributed between the three sources compared with the current or desired availability.
Figure 1 shows how much downtime is left (orange) when the planned service (blue), which is the most predictable, is deducted from the total downtime. In the example I have calculated with 3 days for the service and a 10 hour working day.
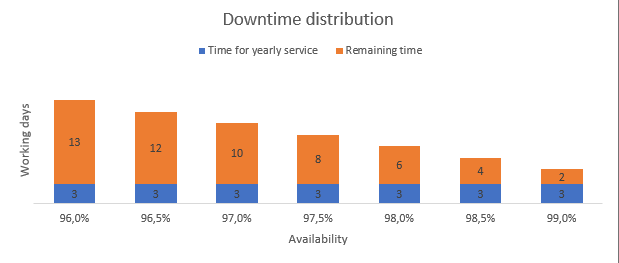
It is clear that planned activities only occupy a very small part of the total downtime. If you can reduce the remaining downtime, there is a great potential that can be transformed into uptime.
What does a given reduction in downtime mean for availability?
Figure 2 shows what reduced downtime means for availability. In the table you can also see which point it has currently reached and break it as an improvement goal in the coming year.
The example situation shows a current availability of 97.5% , equivalent of 219 hours downtime; A 3-day service with a daily working time of 10 hours is deducted from the 219 hours, which is equal to the remaining 189 hours downtime.
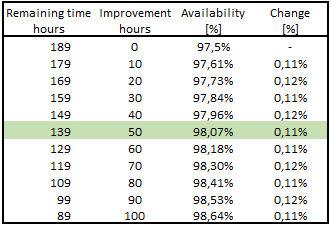
You can see that 10-hour improvement gives you an increase of 0.11% availability for every turbine, so you can make improvements that can be scaled to apply for all turbines in a wind farm – or even better for a whole platform or portfolio of wind turbines – so it really gives you a huge increase in total uptime.
What improvements should you focus on?
The type of improvements that provide the best results are those that can be scaled or that are recurring events. Examples of improvements that are both scalable and happen again and again are the annual scheduled service visits and unscheduled maintenance events.
The annual service visit takes place on all turbines. If you can cut 5 to 10 hours of that service time, it will result in an increase in the availability of 0.06 – 0.11%. It may not sound like much, but if you have a wind farm with e.g. 60 turbines, it will make a big difference – if you can replicate it on several wind farms, it will be even more.
Another example is unscheduled maintenance, where there can be a lot to gain. There are two obvious options – reducing the response time or using preventive maintenance wherever possible. Response time is the time from turbine stop due to a failure until you reach the turbine, ready to perform the corrective action.
There can easily be 10 annual visits to each turbine due to unplanned maintenance. If you can reduce the response time with 3 hours for each visit, it will result in around 0.3% extra annual availability per turbine.
You can also start working with preventive maintenance (PM), and this can really affect availability significantly. PM results in components that previously failed and led to an unplanned visit will disappear completely and will be handled during the annual service.
There are many components in a turbine that PM can be performed on, but estimating conservatively we can convert 3 visits a year to a proactive action that takes place with the service visit on an offshore turbine, so the annual increase in availability can land around 0.7% – 0.8% per turbine.
Case
In this example we will consider an offshore turbine with the following data:
Rated power: 9MW
Availability: 97,5%
Average wind speed: 8 m/s
Electricity price 0,06 EUR/kW
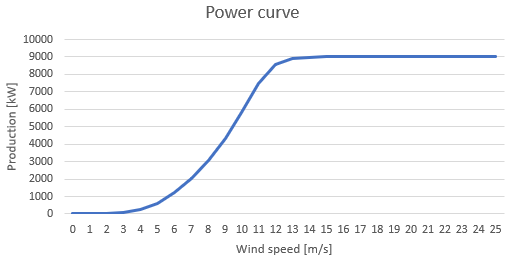
From the power curve we can see production@8m/s is about 3000kW.
We decide to launch an improvement project to reach a 98% availability. This is done by reducing the annual service of 30 hours to 25 hours, and by PM on 2 components. It will leave us with a total improvement of 0.57% for the availability – 97.5 + 0.57 = 98.07%.
We would like to investigate what it means for earnings if we scale to 50 turbines and 250 turbines respectively, as shown in figure 4.
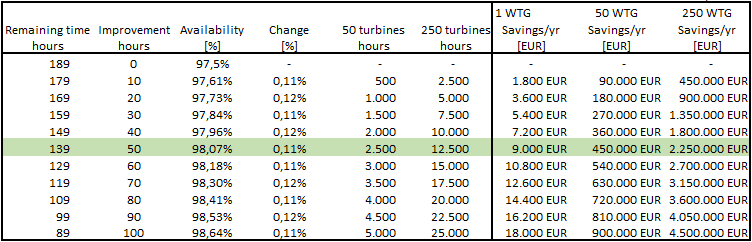
Earnings per turbine increase by EUR 9,000 per year; for a wind farm of 50 turbines, earnings increase by 450,000 EUR per year; For a fleet of several wind farms and with a total of 250 turbines, it will be 2,250,000 EUR per year.
Take away
As you can see from the case, it is possible to increase your annual earnings with a significant amount of money if you improve your service time or start working with preventive maintenance. Improvements result in the most significant difference where something can be scaled, especially considering events that recur annually.
At CrossFields, we build a model of your assets which we use to try out different solutions. This way we find the optimal maintenance strategy that will increase your availability significantly. There are usually more side gains such as lower OPEX, less risk of injury and less environmental emissions.
If you want to learn more about how CrossFields can increase the availability of your assets and lower OPEX, please contact:
CrossFields ApS
Villads Jakobsen
Mobile: +45 6013 5388
Mail: vilja@crossfields.io
Hej, dette er en kommentar.
For at komme i gang med at moderere, redigere og slette kommentarer, skal du gå til kommentarskærmbilledet i kontrolpanelet.
Kommentaravatarer kommer fra Gravatar.